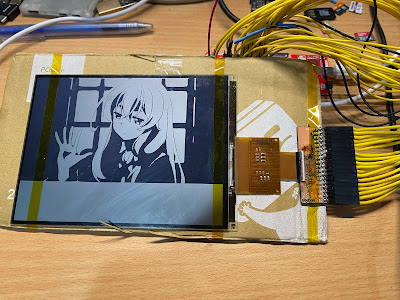
有次網路逛街看到了好便宜的6" Sharp Memory LCD,手癢就買來玩玩看。因為這次螢幕解析度和大小都滿大的,所以想說來做兩個東西: 顯示天氣圖還有如上圖的PC儀表板。
WiFi or BLE? 老實說我想了一陣子,因為800x600資料不少,我原本是很想要用WiFi因為資料下載比較快,但是ESP32的耗電量控制真的慘,不適合這種一直更新的用途,所以還是用BLE。
6" 800x600的解析度,而和之前的Memory LCD差異最大的在於每個pixel是兩個單色sub-pixel組成,所以每個pixel實際上能組成四種黑/白色,資料可以寫4bit的資料,然後控制兩個單色的sub-pixel你就有4色,也可以讓螢幕幫你做dithering擴展成16色階,不過效果在複雜的圖文底下不佳(aka天氣圖)。
其中寫資料可以指定寫入部分的螢幕(類似E-ink的partial update),還可以從frame buffer把資料讀出來(為了支援小容量記憶體的MCU我猜)。然後把資料從frame buffer轉移完之後透過ACK pin通知MCU寫入完畢。另外也可以開Video mode讓LCD自己用30Hz的速度自動轉移Frame buffer到Panel,這時候SYNC pin會有Frame Sync通知MCU。
我為了方便,這邊用的是8bit bus + 單色 + Full Update + 自己下指令轉移buffer。可能之後換成4色。因為800x600單色已經是56K的資料量了,開成4bit=>224K,有點肥。而資料寫入的Bus則是透過把parallel bus安排到GPIO 0 ~ 7 + 直接register set/clr,速度可以拉到10Hz。
接下來就是MCU,基本上nRF系列也不錯,但是我這次想來試試 SparkFun Artemis Module,因為這個Module用的不是常見的BLE SoC,用的是Apollo3b from Ambiq,他們家的MCU非常暴力省電。大學修電子學的時候略有耳聞有些IC工作點是在課本沒有教的sub-threshold region,因為不是在飽和區,工作的電流可以壓到非常低,通常用在手錶這種非常低功耗的IC上面。
不過缺點也很明顯,因為用的人少,軟體的Support其實不怎麼樣,Sparkfun有Arduino Support,但是它是基於Mbed OS,等於是他們包了Mbed OS bridge + Mbed OS去Support Arduino。老實說如果只有這樣的話那就算了,反正我可以直接寫MCU register,但是好死不死他們包的Mbed OS沒有Sleep Mode,也就是說模組會一直耗掉1mA,這我真的不能忍。只好改用Mbed OS來寫,結果發現把Sleep打開會一睡不醒...... 為了能讓我用BLE+Sleep,只好切回去原廠的SDK。
原本打算用兩個CR2032拚幾個月,結果因為螢幕本身就要吃掉500uA了其實做不到,所以還是回頭用Li-ion。電路板其他的基本上就是UART隔離+Sparkfun Bootloader的電路,還有鋰電池充電+降壓模組,最後就是幾個電流的測試點。降壓模組我這邊用的是TPS82740A,看了很久想說來試試看,這個在低耗電量(數百uA)的範圍轉換效率真的很高,Iq也耗很少電,BGA封裝但是很好Layout和焊接,最高頂多輸出200mA但是這種用途非常足夠了。
Apollo3b 其實內建了類似的電路,而且還有一個500歐姆的load resistor,透過比較有load/無load的電壓去計算電池內阻來判定電池容量,滿狂的。只可惜螢幕只能跑3.3V,我也不想另外放電平轉換電路在8bit匯流排上面。
剛剛提到一張Frame也將近56K,所以這裡勢必是需要一點壓縮,原本找了老半天看了老半天的黑白影像壓縮,看來大家都很愛RLE(running length encoding)就跟著.....沒有,用RLP壓完變得更肥。最後覺得乾脆gzip算了結果壓縮比還不錯,上面這張圖壓完只剩下21Kb。
解壓縮直接解到Frame buffer然後寫進去Flash,因為天氣圖有未來兩天半的資料一共七張圖,所以我直接把Flash後面的512K都拿來寫,每次傳之前就把這512K一次清掉。
from bluepy import btle
from bluepy.btle import Scanner, DefaultDelegate
import os
import numpy
from PIL import Image
import PIL.ImageOps as ImageOps
import binascii
from io import BytesIO
import gzip
import time
import requests
from PIL import ImageDraw
from PIL import ImageFont
import requests
from pyquery import PyQuery
os.system('rm *.gif')
class ScanDelegate(DefaultDelegate):
def __init__(self):
DefaultDelegate.__init__(self)
scanner = Scanner().withDelegate(ScanDelegate())
devices = scanner.scan(8.0)
nameToMacAddress = dict()
for dev in devices:
#print("Device %s (%s), RSSI=%d dB" % (dev.addr, dev.addrType, dev.rssi))
for (adtype, desc, value) in dev.getScanData():
#print(" %s = %s" % (desc, value))
if desc == "Complete Local Name":
nameToMacAddress[value] = dev.addr;
print("Connecting...")
dev = btle.Peripheral(nameToMacAddress["SharpMeMoryLC"])
time.sleep(1)
dev.setMTU(2049)
lightSensor = btle.UUID("00002760-08c2-11e1-9073-0e8ac72e1011")
DataService = dev.getServiceByUUID(lightSensor)
uuidConfig = btle.UUID("00002760-08c2-11e1-9073-0e8ac72e0011")
BLE_data = DataService.getCharacteristics(uuidConfig)[0]
def binarize_array(numpy_array):
RED = numpy.array([255, 0, 0])
BLUE = numpy.array([0, 0, 255])
BLACK = numpy.array([0, 0, 0])
GRAY = numpy.array([220, 220, 220])
RED2 = numpy.array([238, 44, 44])
PURPLE = numpy.array([145, 44, 238])
WHITE = numpy.array([255, 255, 255])
red, green, blue = numpy_array.T
redAreas = (red == 255) & (blue == 0) & (green == 0)
blueAreas = (red == 0) & (blue == 255) & (green == 0)
blackAreas = (red == 0) & (blue == 0) & (green == 0)
grayreas = (red == blue) & (blue == green) & (green<255)
red2Areas = (red == 238) & (blue == 44) & (green == 44)
purpleAreas = (red == 145) & (blue == 44) & (green == 238)
output = numpy.full(numpy_array.shape,255, dtype=numpy.uint8)
output[redAreas.T] = (0, 0, 0)
output[blueAreas.T] = (0, 0, 0)
output[blackAreas.T] = (0, 0, 0)
output[grayreas.T] = (0, 0, 0)
output[red2Areas.T] = (0, 0, 0)
output[purpleAreas.T] = (0, 0, 0)
return output
def round_corner(radius):
"""Draw a round corner"""
corner = Image.new('1', (radius, radius), (1))
draw = ImageDraw.Draw(corner)
draw.arc((0, 0, radius * 2, radius * 2), 180, 270, fill=(0),width=3)
return corner
def round_rectangle(size, radius,timeText):
"""Draw a rounded rectangle"""
width, height = size
rectangle = Image.new('1', size, (1))
corner = round_corner(radius)
rectangle.paste(corner, (0, 0))
rectangle.paste(corner.rotate(90), (0, height - radius - 3)) # Rotate the corner and paste it
rectangle.paste(corner.rotate(180), (width - radius -3, height - radius -3))
rectangle.paste(corner.rotate(270), (width - radius-3, 0))
ImageDraw.Draw(rectangle).line((radius,3, width - radius, 3), fill=(0),width=3)
ImageDraw.Draw(rectangle).line((radius,height - 3, width - radius, height - 3), fill=(0),width=3)
ImageDraw.Draw(rectangle).line((3,radius, 3, height - radius), fill=(0),width=3)
ImageDraw.Draw(rectangle).line((width - 3,radius, width - 3, height - radius), fill=(0),width=3)
fnt = ImageFont.truetype('./FreeMonoBold.ttf', 22)
x,y = ImageDraw.Draw(rectangle).textsize(timeText,font=fnt)
ImageDraw.Draw(rectangle).text((int((width-x)/2), int((height-y)/2)),timeText,(0),font=fnt)
return rectangle
baseURL = 'https://www.wpc.ncep.noaa.gov'
r = requests.get('https://www.wpc.ncep.noaa.gov/basicwx/basicwx_ndfd.php')
pq = PyQuery(r.text)
periodList = ['period1','period2','period3','period4','period5','period6','period7']
filelist = []
timeList = []
for period in periodList:
tag = pq('div#'+period+' img')
if len(tag) == 0:
continue
fileName = tag.attr['src'].split('/')[2]
timeName = tag.attr['alt'].split(' ')[-1] + " " + tag.attr['alt'].split(' ')[-2][0:3]
print('FileName: %s, Time: %s' % (fileName,timeName))
os.system('wget ' + baseURL + tag.attr['src'])
filelist.append(fileName)
timeList.append(timeName)
count = 0
for filename in filelist:
print(filename)
image = Image.open(filename)
#label = image.crop((393, 659, 393+250, 712))
label = image.crop((437, 684, 437+55, 684+12))
#print(pytesseract.image_to_string(label, lang='eng'))
#print(pytesseract.image_to_data(label))
label = label.resize((100,21))
label = label.convert('L')
label = label.convert('1')
image = image.resize((800,558))
image = image.convert('RGB')
pix = numpy.array(image)
pix = binarize_array(pix)
image = Image.fromarray(pix)
image = image.convert('L')
image = image.convert('1')
image2 = Image.new('1',(800,600),(1))
image2.paste(image, (0, 41))
rect = round_rectangle((110,42),10,timeList[count])
image2.paste(rect, ((800/len(filelist))*count, 0))
#image2.paste(label,(110*count + 5, 10))
count = count + 1
image2.save(filename + '.bmp')
pix = numpy.array(image2)
bitArray = bytearray()
for x in pix:
row_int = numpy.packbits(numpy.uint8(x))
for y in row_int:
bitArray.append(y)
pass
out = open(filename+'.gz','wb')#BytesIO()
with gzip.GzipFile(fileobj=out, mode="wb") as f:
f.write(bitArray)
out.close()
BLE_data.write(b'\xFE')
for filename in filelist:
print("Sending %s" % filename)
with open(filename + ".gz", "rb") as f:
byte = f.read(240)
print(len(byte))
while byte != b"":
BLE_data.write(len(byte).to_bytes(1,'big')+byte)
byte = f.read(240)
#time.sleep(0.1)
BLE_data.write(b'\x00')
time.sleep(10)
//https://stackoverflow.com/questions/8887686/arc-subdivision-algorithm/8889666#8889666
void f(float cx, float cy, float px, float py, float theta, int N)
{
float dx = px - cx;
float dy = py - cy;
float r2 = dx * dx + dy * dy;
float r = sqrt(r2);
float ctheta = cos(theta/(N-1));
float stheta = sin(theta/(N-1));
//std::cout << cx + dx << "," << cy + dy << std::endl;
for(int i = 1; i != N; ++i)
{
float dxtemp = ctheta * dx - stheta * dy;
dy = stheta * dx + ctheta * dy;
dx = dxtemp;
writePixel(cx + dx, cy + dy, BLACK);
//std::cout << cx + dx << "," << cy + dy << std::endl;
}
}
void plotArc(struct arc_struct *plot){
plot->angle = plot->value / (plot->max - plot->min) * 360;
for(float x=plot->innerR;x<plot->outerR;x+=0.5){
f(plot->origin_x, plot->origin_y, plot->origin_x, plot->origin_y-x, plot->angle/180*3.14,350);
}
drawCircle(plot->origin_x, plot->origin_y,plot->innerR-2,BLACK);
drawCircle(plot->origin_x, plot->origin_y,plot->outerR+1,BLACK);
setTextColor(BLACK);
setTextSize(3);
char buf[20]={0};
int n = sprintf(buf,"%.0f%s",plot->value,plot->unit);
int16_t x1,y1,w,h;
getTextBounds(buf,0,0,&x1, &y1,&w,&h);
setCursor(plot->origin_x-w/2,plot->origin_y-h/2);
for(int i=0;i<n;i++){
LCDwrite(buf[i]);
}
setTextSize(2);
n = sprintf(buf,"%s",plot->plotName);
getTextBounds(buf,0,0,&x1, &y1,&w,&h);
setCursor(plot->origin_x-w/2,plot->origin_y+plot->outerR+18-h/2);
for(int i=0;i<n;i++){
LCDwrite(buf[i]);
}
}
其實效率非常差,我的畫法是一堆Arc填滿,但是應該要用Boundary + Fill algorithm,之後再來改進吧。其他Widget就還好了,都還算簡單,Code滿亂的改天整理完再Po。
耗電量這邊也可以看到畫圖花了非常久,大概400ms才畫完。
平均耗電量約莫1.3mA,不低但是搭配2500mAh的電池也是有兩個多月的使用時間。
資料靠HWiNFO + Python Script,HWiNFO 可以把資料導向一個UDP port,然後Python去收。
只是BLE連線我目前暫時是用RPI Zero 來處理,然後透過USB Ethernet device直接連到我的PC。
大概就是這樣,順帶一提買了一台新的3DP MK3S+真的好好用,按鍵一按下去電腦的3D模型就生出來了呢,這次的外殼就是新3D印表機弄的,連螺絲都是組裝剩下的備料XD


